


10/04/2024
Project Finance: The data journey
Transform companies with analytics for informed decision-making, transparency across teams, and improved controls.

What is a data journey?
In the world of project finance, the journey from Excel to a data platform signifies a transformative shift for an organization. Traditionally, Excel has been the foundation for managing financial data, offering flexibility and ease of use. However, as a company scales to have more projects in development and operations, the limitations of utilizing native Excel without a data platform become increasingly apparent: manual data entry, error-prone calculations, and lack of real-time insights. Transitioning to a framework that focuses on leveraging data helps address these challenges by enabling automation, data integrations, data visualization, and real-time analytics. This transition not only enhances the accuracy and efficiency of financial reporting but also empowers stakeholders with the information they need to make strategic decisions. Becoming a more data-driven organization can also significantly enhance performance, which can improve the bottom line and therefore increase the overall valuation of the company.
We often refer to this transformative shift as a data journey, as this is often an iterative process rather than a one-time endeavor.
It is important to recognize that not all processes will evolve at the same pace. Some elements, such as budgeting and forecasting, might transition quickly to software or other automated solutions. However, other areas, like complex financial modeling based on corporate financing strategies or ad hoc analysis, might continue to rely on Excel due to its flexibility and customization to the organization’s strategy. This uneven progression is a natural part of the data journey, reflecting the unique needs and challenges of different processes. Therefore, a successful strategy should focus first on items such as reducing operating risks, unlocking more time for your team, or simply a quick win to demonstrate the value of data-driven solutions. Each strategy should be flexible and adaptable, allowing each process to evolve at its own pace while maintaining overall alignment with the organization’s goals.
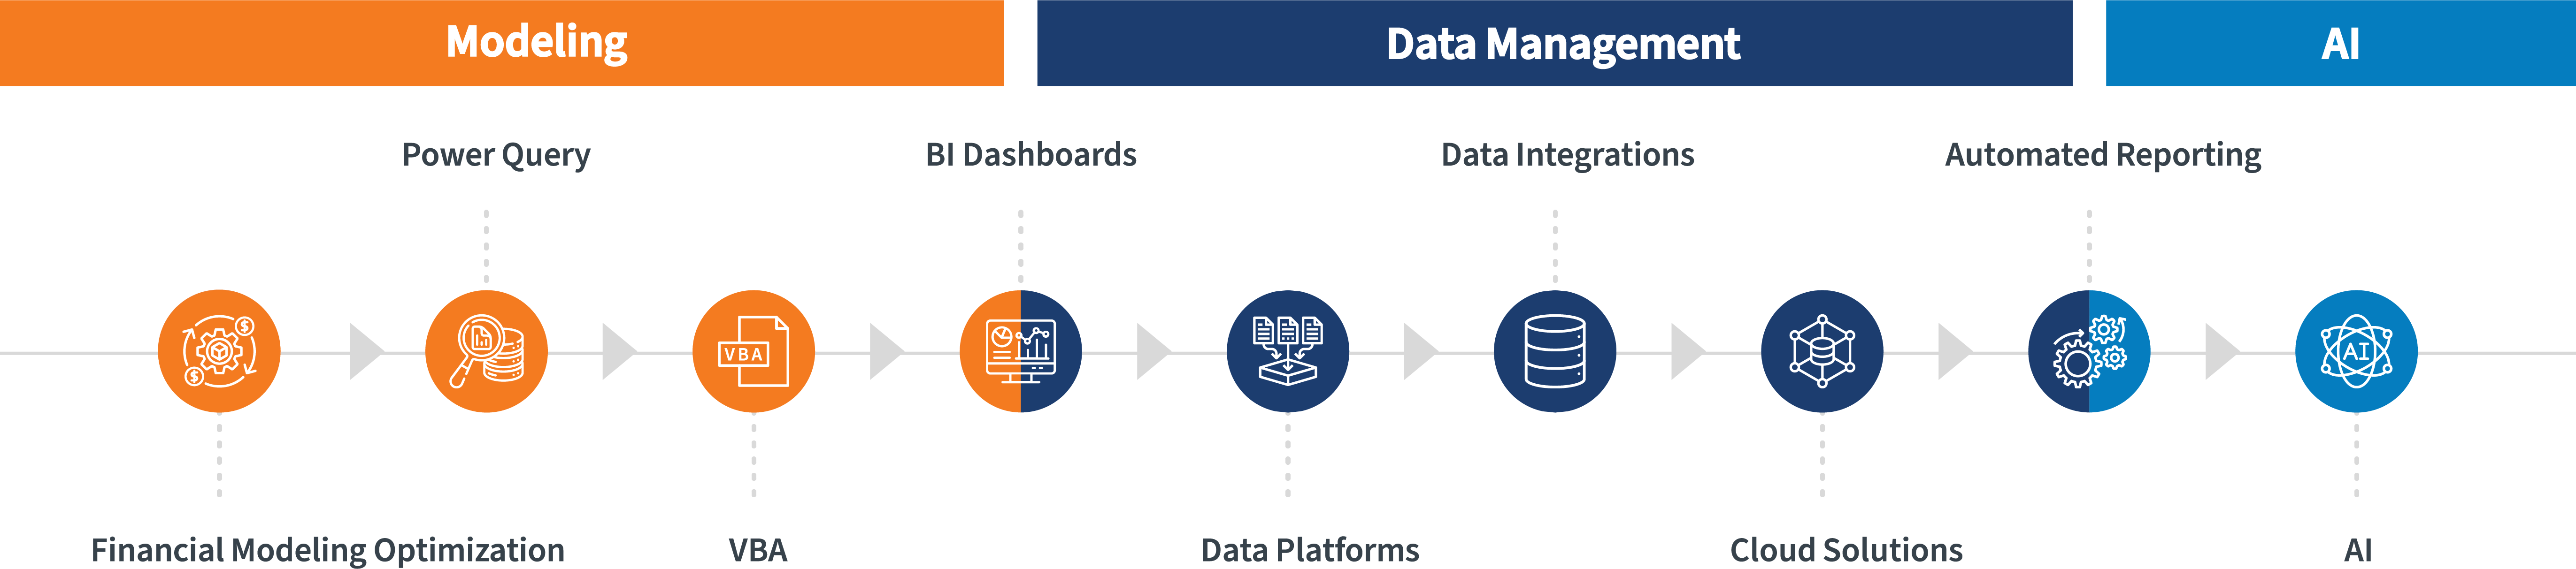
Here, we delve into the specific technologies and solutions that can be leveraged along your data journey. The order in which these processes transition will vary for each company, depending on their unique needs and priorities. The end goal is the same: A targeted approach that not only enhances accuracy and efficiency, but also empowers stakeholders with the insights they need to make informed decisions.
Financial modeling optimization
Optimizing financial models is a critical first step in the data journey. As the complexity of project financing grows, the need for standardized, robust, and accurate financial models becomes paramount. Optimization involves refining model templates to improve their accuracy, ease of use, internal controls, and functionality. This could mean verifying the formulas used in the model, streamlining data inputs and outputs, or improving the user interface for a better user experience. Techniques such as sensitivity analysis and scenario planning can be incorporated to assess the impact of varying assumptions on the economic viability of projects.
Typically, there are project-level models that focus on individual projects and corporate-level models that provide a broader view of the organization’s financial health. Project-level models are essential for assessing the feasibility and performance of specific projects, while corporate-level models help in strategic planning and overall financial management. Additionally, preparing model templates for downstream reporting and consolidation such as database storage, corporate financial models, and/or business intelligence (BI) dashboards helps ensure that data flows seamlessly through various stages of financial analysis and reporting.
It’s important to remember that optimization is not a one-time task but an ongoing process. As business environments evolve and new data becomes available, financial models should be continually reviewed and updated to remain relevant and effective. Ultimately, the goal of optimizing financial models is to provide decision-makers with reliable, insightful, and timely information, enabling them to make informed decisions that drive the organization’s strategic and financial objectives.
Ready to get started? Explore our services.
Power Query
Power Query, a data connection technology from Microsoft built into Excel and Power BI, is an invaluable tool for teams who are constantly consolidating project models. With Power Query, FP&A teams can easily connect to multiple project models, whether they’re stored in Excel workbooks, databases, or cloud-based platforms. The tool allows users to extract relevant data, apply transformations, and consolidate the information into a unified data model. This process significantly reduces the manual effort involved in data consolidation, enabling more accurate and timely financial reporting. Moreover, Power Query’s ability to automatically refresh data connections means that the data remains up to date, reflecting the latest changes in the underlying project models. Project finance companies may want to consolidate data for various reasons, whether that is consolidating development costs to understand the company’s capital requirements or aggregating deal terms across their portfolio to understand their typical project profile. This real-time visibility into project data is crucial for finance teams, enabling efficient reporting and more informed decision-making. (Note: If the same data is going to be used in multiple different solutions, such as different types of financial models or business intelligence (BI) dashboards, it is often worth considering investing in developing a database to serve these solutions. More on that later.)
Ready to get started? Explore our services.
Visual Basic for Applications
Visual Basic for Applications (VBA), a programming language integrated into Microsoft Office applications (including Excel), allows users to automate repetitive tasks, such as importing (and refreshing) data, scenario analysis, and solving for deal terms, thereby increasing efficiency and eliminating manual processes. Beyond automation, VBA also enables users to develop interactive user interfaces that have a software-like experience. This can significantly enhance the functionality and flexibility of financial models, enabling them to handle more complex scenarios and deliver more accurate results while still having a great user experience. Automation tasks can range from highly complex to something as simple as showing or hiding worksheets before sending a workbook to a specific audience.
While VBA offers powerful capabilities, it also requires a certain level of programming knowledge. Therefore, training and support are often necessary to leverage VBA effectively. Despite this, the benefits of automation and customization that VBA provides make it an invaluable tool in a finance professional’s toolkit.
Ready to get started? Explore our services.
Business intelligence (BI) dashboards
Business intelligence (BI) dashboards aggregate data from various sources and present it in an intuitive format, such as charts, graphs, and tables, which enable stakeholders to gain a quick overview of their business or division at a glance. More detailed data can often be accessed through the “drill down” feature, which gives the user the ability to see the detail behind the summarized data for deeper discovery.
One of the primary benefits of BI dashboards is that they facilitate informed decision-making by helping identify trends, spot anomalies, and monitor progress against goals. This detail enables proactive decision-making and swift action in response to changing business conditions.
BI dashboards also promote transparency and alignment within the organization. Data is readily available to all relevant stakeholders, which allows everyone to view reports from a single source of truth. This not only reduces confusion and miscommunication, but also fosters a culture of data-driven decision-making. Often, BI dashboards are served through a single website URL that can be shared across the organization, helping to provide the most up-to-date information and eliminate version control headaches.
Furthermore, BI dashboards can be customized to meet the unique needs of different users. Whether it’s a high-level dashboard for executives or a more detailed dashboard for analysts, the ability to tailor the information displayed helps ensure that each user has the most relevant and useful data at their fingertips.
Ready to get started? Explore our services.
Data platforms
If multiple solutions will be accessing the same data, it is often wise to begin to develop a database to serve as the mechanism to store and retrieve this data. Capturing data in an enterprise data store, such as a data lake or lakehouse, provides the single point of truth required for authoritative reporting and analytics. The use of data lakes and lakehouses in modern cloud solutions cuts the cost of storing and using data. It also simplifies the storage structure, making integration, storage, and use much faster and less expensive than previously possible with data warehousing and marting. Data lakes enable more efficient data integration, as data from disparate sources can be consolidated into a unified format; they support all types of structured data, as well as documents and other data types. The lake is also the place where artificial intelligence (AI) tools, including machine learning and generative AI services, can best leverage data.
Microsoft Fabric is an end-to-end analytics and data platform designed for enterprises that require a unified solution. It integrates the different components of a data platform into a cohesive stack, providing seamless data movement, processing, ingestion, transformation, and real-time event routing. Solutions such as Prevedere can enhance this platform by offering advanced forecasting capabilities, leveraging millions of external data points to provide robust benchmarking and predictive analytics through enriching an organization’s data sets.
Ready to get started? Explore our services.
Data integrations
Automated data integration is a crucial aspect of modern data architecture. Data pipelines move data from diverse source systems, spreadsheets, and other sources into a coherent, quality-controlled format with cost-effective historical management. Often referred to as “ETL,” the extract, transform, and load process – extraction, transformation into a standard data format, and loading into your cloud storage environment – brings your data together into a single, integrated store with cost-effective quality and history. This not only enhances data consistency and accessibility but also simplifies the process of data analysis and reporting.
Data pipelines also handle different types of data – structured, semi-structured, or unstructured – and different data formats, making them highly versatile. In essence, data pipelines act as the highway of an organization’s data ecosystem, transporting data from where it is generated to where it can be stored, analyzed, and turned into actionable insights.
Ready to get started? Explore our services.Cloud solutions
Cloud-based solutions now address every aspect of data and analytics needs more cost-effectively than ever. Cloud-based development is 1.5 to 3 times as rapid as traditional premise-based development technology. Data integration and the use of powerful AI tools are further enabled by the modern cloud fabric architecture. Data visualization, predictive modeling, and complex scenario analysis all occur in cloud-based solutions at a pace that is vastly accelerated and very cost-effective. These solutions can streamline processes, enhance efficiency, and provide valuable insights across various sectors. For instance, cloud-based data integration consolidates information from multiple sources, enabling organizations to have a unified view of their data. This is crucial for making informed decisions, regardless of the industry. Cloud-based analytics provide comparative and predictive analysis of project- and portfolio-level financial performance.
Ready to get started? Explore our services.
Automated reporting
Automated reporting eliminates the need for manual data extraction and compilation, thereby saving time, reducing errors, and enabling timely access to critical business information. A powerful automated reporting ecosystem can deliver reliable, up-to-date, and actionable business insights, whether internally for executives or externally to meet compliance requirements such as to investors or lenders.
First, the organization’s data platform needs to be designed with reporting requirements in mind. This means making sure that all necessary data is being captured and processed, and that the data is being transformed into a format that aligns with reporting needs. Secondly, the financial model, database, or other solutions should be structured in a way that facilitates easy data retrieval and analysis. Finally, automation should be integrated with the solution to automate the generation and distribution of reports. These tools can pull data directly from the solution, apply predefined analysis, and then distribute the reports to relevant stakeholders on a scheduled basis.
It is important to establish a feedback loop for continuous improvement. This involves regularly reviewing automated reports for accuracy and relevance, and then refining the solution based on this feedback.
Ready to get started? Explore our services.Artificial intelligence
Artificial intelligence (AI) can play a transformative role in leveraging all the elements we’ve discussed, from data integration and warehousing to automated reporting. AI can be used to automate and enhance various stages of the data journey. For instance:
- Machine learning techniques can be applied to improve the accuracy of financial models, predict future trends, and identify anomalies in real time.
- In the context of data integration, AI can help in cleaning and transforming data, dealing with missing values, and even predicting future data points.
- AI can revolutionize reporting by enabling predictive analytics, where future outcomes and trends are predicted based on historical data. This can provide businesses with a forward-looking perspective, helping them make proactive decisions.
- Natural language processing (NLP), a subset of AI, can be used to create interactive BI dashboards where users can ask questions in natural language and get answers in the form of reports or visualizations.
In essence, AI acts as a force multiplier, enhancing the capabilities of each element of the data journey and enabling organizations to derive greater value from their data. By integrating AI into their data strategy, businesses can not only improve efficiency and accuracy but also uncover deeper insights, drive innovation, and gain a competitive edge.
Ready to get started? Explore our services.In conclusion
By enhancing and complementing traditional Excel-based processes and embracing the different solutions in the data journey, organizations can significantly enhance their reporting and decision-making capabilities. The journey is unique for each company, with varying paces and priorities, but the goal remains the same: to provide reliable, insightful, and timely information that drives strategic and financial objectives. As business environments evolve, staying adaptable and committed to ongoing improvement will help ensure that the data journey continues to deliver value and support the organization's long-term success.
How CohnReznick can help
Remember that manual processes create time constraints, can be costly, and do not add value. CohnReznick can help you eliminate or significantly speed up highly repetitive processes so that your team can focus on higher-value work.
Embarking and navigating the data journey is a transformative endeavor that requires careful planning, strategic prioritization, and continuous optimization. Let us be your trusted advisor as you map your journey toward a more data-driven future.
-
• Custom build of financial models or specific portions of models to the needs of your company
• Layering in CohnReznick’s industry-specific financial modeling templates
• Review of existing models for accuracy, user experience, internal controls, and/or functionality
• Optimizing financial model data to be used in downstream reporting such as database storage, corporate financial models, and/or BI dashboards
-
• Consolidation of models for purposes of liquidity analysis, tax calculations, or other use cases where up-to-date project-level data is required
• Transitioning existing manual “copy and paste” data import processes into an automated solution as simple as clicking a button
• Consolidation of data across different data sources into an Excel-based financial model
-
• Automating the import and refresh of data into a financial model with a button click
• Using existing financial models to run scenarios across a portfolio of models
• Custom-built VBA automation into models or processes
-
• Custom build of BI dashboards to the needs of your company
• Integrating CohnReznick’s industry-specific financial modeling templates for purposes of liquidity analysis, capital markets summarization, tax, and financial reporting
• Providing a single source of truth across teams to easily slice and dice data in easy-to-use interactive user interfaces
-
• Accelerated data lake, lakehouse, reporting, and analytic delivery with integrity and quality
• Implementing CohnReznick’s industry-specific data and analytic models leveraging our financial models
• Delivering operational reporting, scenario and cross-scenario analysis, and data visualizations to simplify the complex
-
• Rapid development of data integration pipelines with automated quality controls, accelerating reporting and analytics from a trusted data source
-
• Advise on, design, and rapidly implement or expand your cloud services and outcomes from data integration through advanced analytics
• Enhance your cloud and data security while improving data quality with automated controls
-
• Custom build of automated reporting using existing company processes
• Implementing CohnReznick’s existing industry-specific automated reporting solutions
• Automatically generate and share specific information to stakeholders on demand or at pre-defined intervals
-
• Custom build of artificial intelligence (AI) solutions based on company needs
• Generating summaries of complex content and producing narrative content based on data; professionals then standardize all narrative terms


Michael Ruth
Senior Manager, Project Finance and Consulting
Looking for the full list of our dedicated professionals here at CohnReznick?
Close
Contact
Let’s start a conversation about your company’s strategic goals and vision for the future.
Please fill all required fields*
Please verify your information and check to see if all require fields have been filled in.


Related services
Our solutions are tailored to each client’s strategic business drivers, technologies, corporate structure, and culture.
Receive CohnReznick insights and event invitations on topics relevant to your business and role.
This has been prepared for information purposes and general guidance only and does not constitute legal or professional advice. You should not act upon the information contained in this publication without obtaining specific professional advice. No representation or warranty (express or implied) is made as to the accuracy or completeness of the information contained in this publication, and CohnReznick, its partners, employees and agents accept no liability, and disclaim all responsibility, for the consequences of you or anyone else acting, or refraining to act, in reliance on the information contained in this publication or for any decision based on it.